Forums
Forums
Guest
|
|---|
| Welcome Guest, posting in this forum require registration. |
|
|
Torque » Torque OBD ECU Scanner » Torque Discussion / Ideas » O2 sensor voltages and rate of data sampling
| Pages: [1] |
 Author Author |
Topic: O2 sensor voltages and rate of data sampling |
|---|
| Bill
Member Posts: 1 |
|
||||
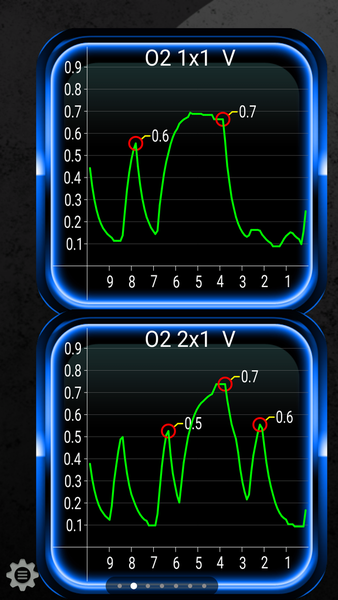
 O2 sensor voltages and rate of data sampling
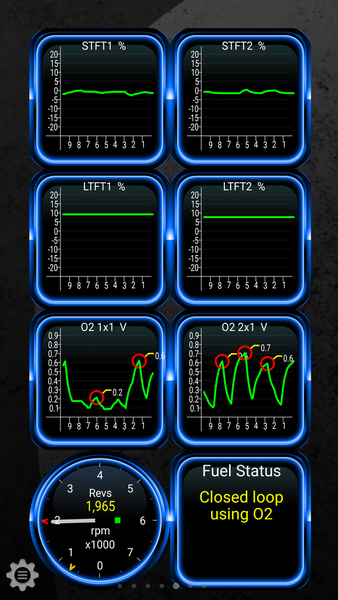
| F-150Torqued
Member Posts: 437 |
|
||||
| Pages: [1] |
Page loaded in: 0.01 seconds.